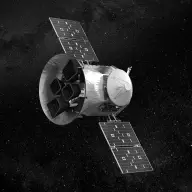
25 missions in this study. 63,383 tracked publications and 3,416,710 citations over their lifetimes.
Exploring stars, galaxies and the universe beyond our solar system.
Research over time
Tracked publicationsCitations
Dashed: 2026 is not yet a full year.
ScopePapers published from the first full month after science operations begin through 2 years after the mission ends. Citations are counted through the third calendar year after each paper appears. Methods/Papers published from the first full month after science operations begin through 2 years after the prime mission ends. Citations are counted through the third calendar year after each paper appears. Methods/Every tracked publication to date, with every citation to date. Methods
Key measures
Active Mission Window
Missions
2525
Tracked publicationsTracked publications: peer-reviewed research papers we found for the mission. The list may not be complete. Methods
49,84949,849
CitationsCitations received by the tracked publications in the selected scope. The two windowed scopes count each paper’s citations only within its citation window. Methods
1,106,3171,106,317
Mean citations per publicationMean citations: total citations divided by tracked publications in the selected scope. One blockbuster paper can lift it. Methods
2222
Median citations per publicationMedian citations: the middle paper’s citation count in the selected scope; half the papers have more, half fewer. A single blockbuster sways it less than the mean. Methods
1313
Uncited publicationsUncited publications: papers with no citations in the selected scope. Methods
2,452 (4.9%)2,452 (4.9%)
h-indexh-index: the largest h such that h papers have at least h citations each. It only grows with time, so older missions score higher. Methods
220220
Citations held by the top 10% of papersThe share of all citations in the selected scope that went to the 10% most-cited papers from this division’s missions. The higher it is, the more attention concentrates on a few papers. Methods
44%44%
Percentile citation cutoffs · Active Mission Window
Top 0.1%Cutoff: the fewest citations a paper needs to rank in the top share named, among every paper from this division’s missions in the selected scope, ties included. The count beside it is the papers at or above that line. Not adjusted for publication year. Methods
514514· 50 papers at or above
Top 1%Cutoff: the fewest citations a paper needs to rank in the top share named, among every paper from this division’s missions in the selected scope, ties included. The count beside it is the papers at or above that line. Not adjusted for publication year. Methods
145145· 506 papers at or above
Top 5%Cutoff: the fewest citations a paper needs to rank in the top share named, among every paper from this division’s missions in the selected scope, ties included. The count beside it is the papers at or above that line. Not adjusted for publication year. Methods
6868· 2,543 papers at or above
Top 10%Cutoff: the fewest citations a paper needs to rank in the top share named, among every paper from this division’s missions in the selected scope, ties included. The count beside it is the papers at or above that line. Not adjusted for publication year. Methods
4646· 5,119 papers at or above
Top 25%Cutoff: the fewest citations a paper needs to rank in the top share named, among every paper from this division’s missions in the selected scope, ties included. The count beside it is the papers at or above that line. Not adjusted for publication year. Methods
2525· 13,075 papers at or above
Top 50%Cutoff: the fewest citations a paper needs to rank in the top share named, among every paper from this division’s missions in the selected scope, ties included. The count beside it is the papers at or above that line. Not adjusted for publication year. Methods
1313· 25,337 papers at or above
Highly cited papers per missionTop 10%: among the 10% most-cited papers from this division’s missions, ranked against papers published around the same time. A paper naming several missions is split evenly among the missions in this division that claim it, so counts can be fractional. A failed mission counts as zero and is marked with a slash; a mission whose output could not be measured is left out, not counted as zero. Methods
Top /
Papers from each mission that rank in the division’s top 10% for their era.
Time to a first top-10% paperFirst top-10% paper: the earliest-published paper that ranks in its division’s top 10% today, measured from the start of science operations. A paper dated before that start was added by hand and comes from cruise or flyby science. A failed mission counts as zero and is marked with a slash; a mission whose output could not be measured is left out, not counted as zero. Cost: life-cycle cost including partner contributions, in 2025 dollars (NASA’s New Start Index). Methods
20 of 25 missions have a recorded time to a first top-10% paper and a known positive cost in this view.
Each square is a mission: higher costs more; farther left reached its first top-10% paper sooner after science operations began.
Adjusted mission cost · log scale ↑
SWAS
$136M · 18.3 months after science start
First top-10% paper: August 2000; HETE 2
$158M · 23.8 months after science start
First top-10% paper: February 2003; NuSTAR
$248M · 10 months after science start
First top-10% paper: June 2013; GALEX
$282M · 17 months after science start
First top-10% paper: January 2005; FUSE
$298M · 7 months after science start
First top-10% paper: July 2000; WMAP
$303M · 17 months after science start
First top-10% paper: January 2003; TESS
$387M · 0.2 months after science start
First top-10% paper: August 2018; Swift
$456M · 1.9 months after science start
First top-10% paper: June 2005; WISE
$484M · 0.8 months after science start
First top-10% paper: February 2010; RXTE
$490M · 7.1 months after science start
First top-10% paper: September 1996; COBE
$589M · 5.3 months after science start
First top-10% paper: May 1990; EUVE
$720M · 18.3 months after science start
First top-10% paper: February 1994; IRAS
$816M · 12.2 months after science start
First top-10% paper: March 1984; Kepler
$1.1B · 2.6 months after science start
First top-10% paper: August 2009; Fermi
$1.3B · 0.9 months after science start
First top-10% paper: September 2008; GP-B
$1.4B · 1.1 months after science start
First top-10% paper: October 2004; SIRTF
$1.6B · 0.5 months after science start
First top-10% paper: January 2004; CGRO
$2.0B · 8.9 months after science start
First top-10% paper: January 1992; Chandra
$7.5B · 4.7 months after science start
First top-10% paper: January 2000; HST
$14B · 1.2 months after science start
First top-10% paper: June 1990
Running total of all top / papers, contributed by missionTop 10%: among the 10% most-cited papers from this division’s missions, ranked against papers published around the same time. Missions sit at their own cost on a log scale. The line is the running total of the division’s top-10% papers, adding missions from cheapest to costliest. The dashed line at $150M is an editorial comparison point, not an inferred scientific threshold. Cost: life-cycle cost including partner contributions, in 2025 dollars (NASA’s New Start Index). Methods
Running total of the division’s top-10% papers, adding missions from cheapest to costliest: 4,985 papers across 25 missions from $5.2M to $14B.