Astrophysics
NASA's Astrophysics Division is responsible for the study of the universe, primarily using space telescopes.
Publications and citations by year
Publications per yearCumulative citations
Citations per $100M, by mission
Each square is a mission at its cost and its citations per $100M, both on log scales. The running average combines mission rates across a broad range of nearby costs, giving closer missions more weight. Missions with no citations remain included and sit on the bottom row. Shading shows a 95% interval for the average at each cost.
Missions
| Image | ||||||
|---|---|---|---|---|---|---|
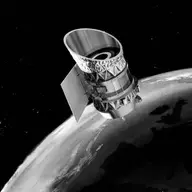 | IRAS | 1983 | Pointed Observatory | $816M | 371 | 20,981 |
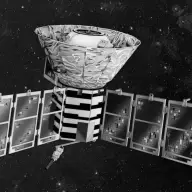 | COBE | 1989 | Survey Observatory | $589M | 1,417 | 120,966 |
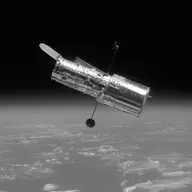 | Hubble | 1990 | Pointed Observatory | $14B | 18,927 | 1,185,287 |
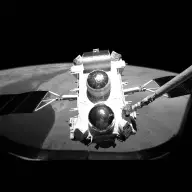 | Compton | 1991 | Survey Observatory | $2.0B | 2,769 | 150,525 |
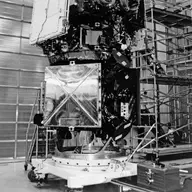 | EUVE | 1992 | Survey Observatory | $720M | 473 | 18,569 |
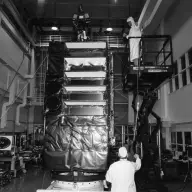 | RXTE | 1995 | Survey Observatory | $490M | 2,578 | 122,358 |
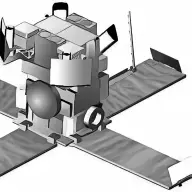 | HETE 1 Failure | 1996 | Survey Observatory | $159M | 0 | 0 |
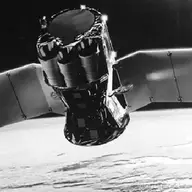 | SWAS | 1998 | Survey Observatory | $136M | 76 | 2,992 |
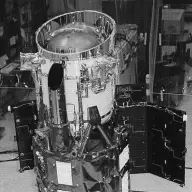 | WIRE Partial success | 1999 | Survey Observatory | $149M | 24 | 989 |
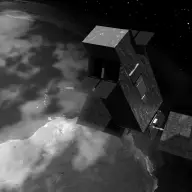 | FUSE | 1999 | Pointed Observatory | $298M | 799 | 38,180 |
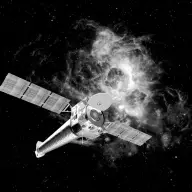 | Chandra | 1999 | Pointed Observatory | $7.5B | 9,224 | 465,262 |
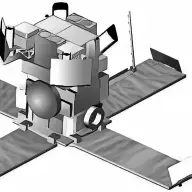 | HETE 2 | 2000 | Survey Observatory | $184M | 127 | 11,196 |
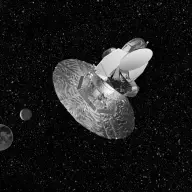 | WMAP | 2001 | Survey Observatory | $303M | 3,298 | 344,234 |
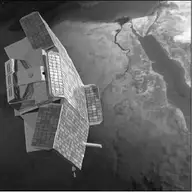 | CHIPS | 2003 | Survey Observatory | $27M | 4 | 88 |
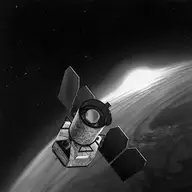 | GALEX | 2003 | Survey Observatory | $282M | 1,582 | 94,172 |
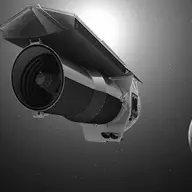 | Spitzer | 2003 | Pointed Observatory | $1.6B | 6,423 | 426,956 |
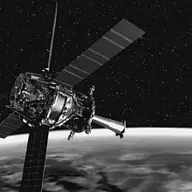 | GP-B | 2004 | Pointed Observatory | $1.4B | 124 | 3,813 |
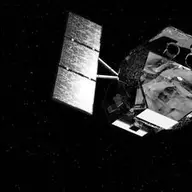 | Swift | 2004 | Pointed Observatory | $456M | 5,527 | 233,870 |
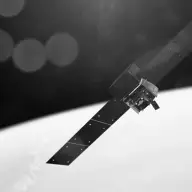 | Fermi | 2008 | Survey Observatory | $1.3B | 6,653 | 296,196 |
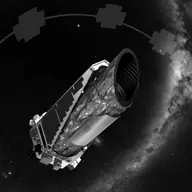 | Kepler | 2009 | Survey Observatory | $1.1B | 4,596 | 239,755 |
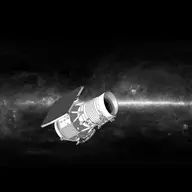 | WISE | 2009 | Survey Observatory | $484M | 2,607 | 107,904 |
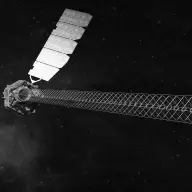 | NuSTAR | 2012 | Pointed Observatory | $248M | 1,936 | 55,277 |
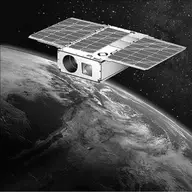 | ASTERIA | 2017 | Pointed Observatory | $6.5M | 3 | 46 |
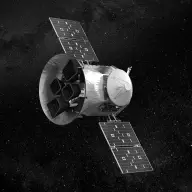 | TESS | 2018 | Survey Observatory | $387M | 3,618 | 67,350 |
 | HaloSat | 2018 | Survey Observatory | $5.2M | 15 | 217 |