Science Mission Impact: how does science impact and productivity scale with cost?
Skip to divisions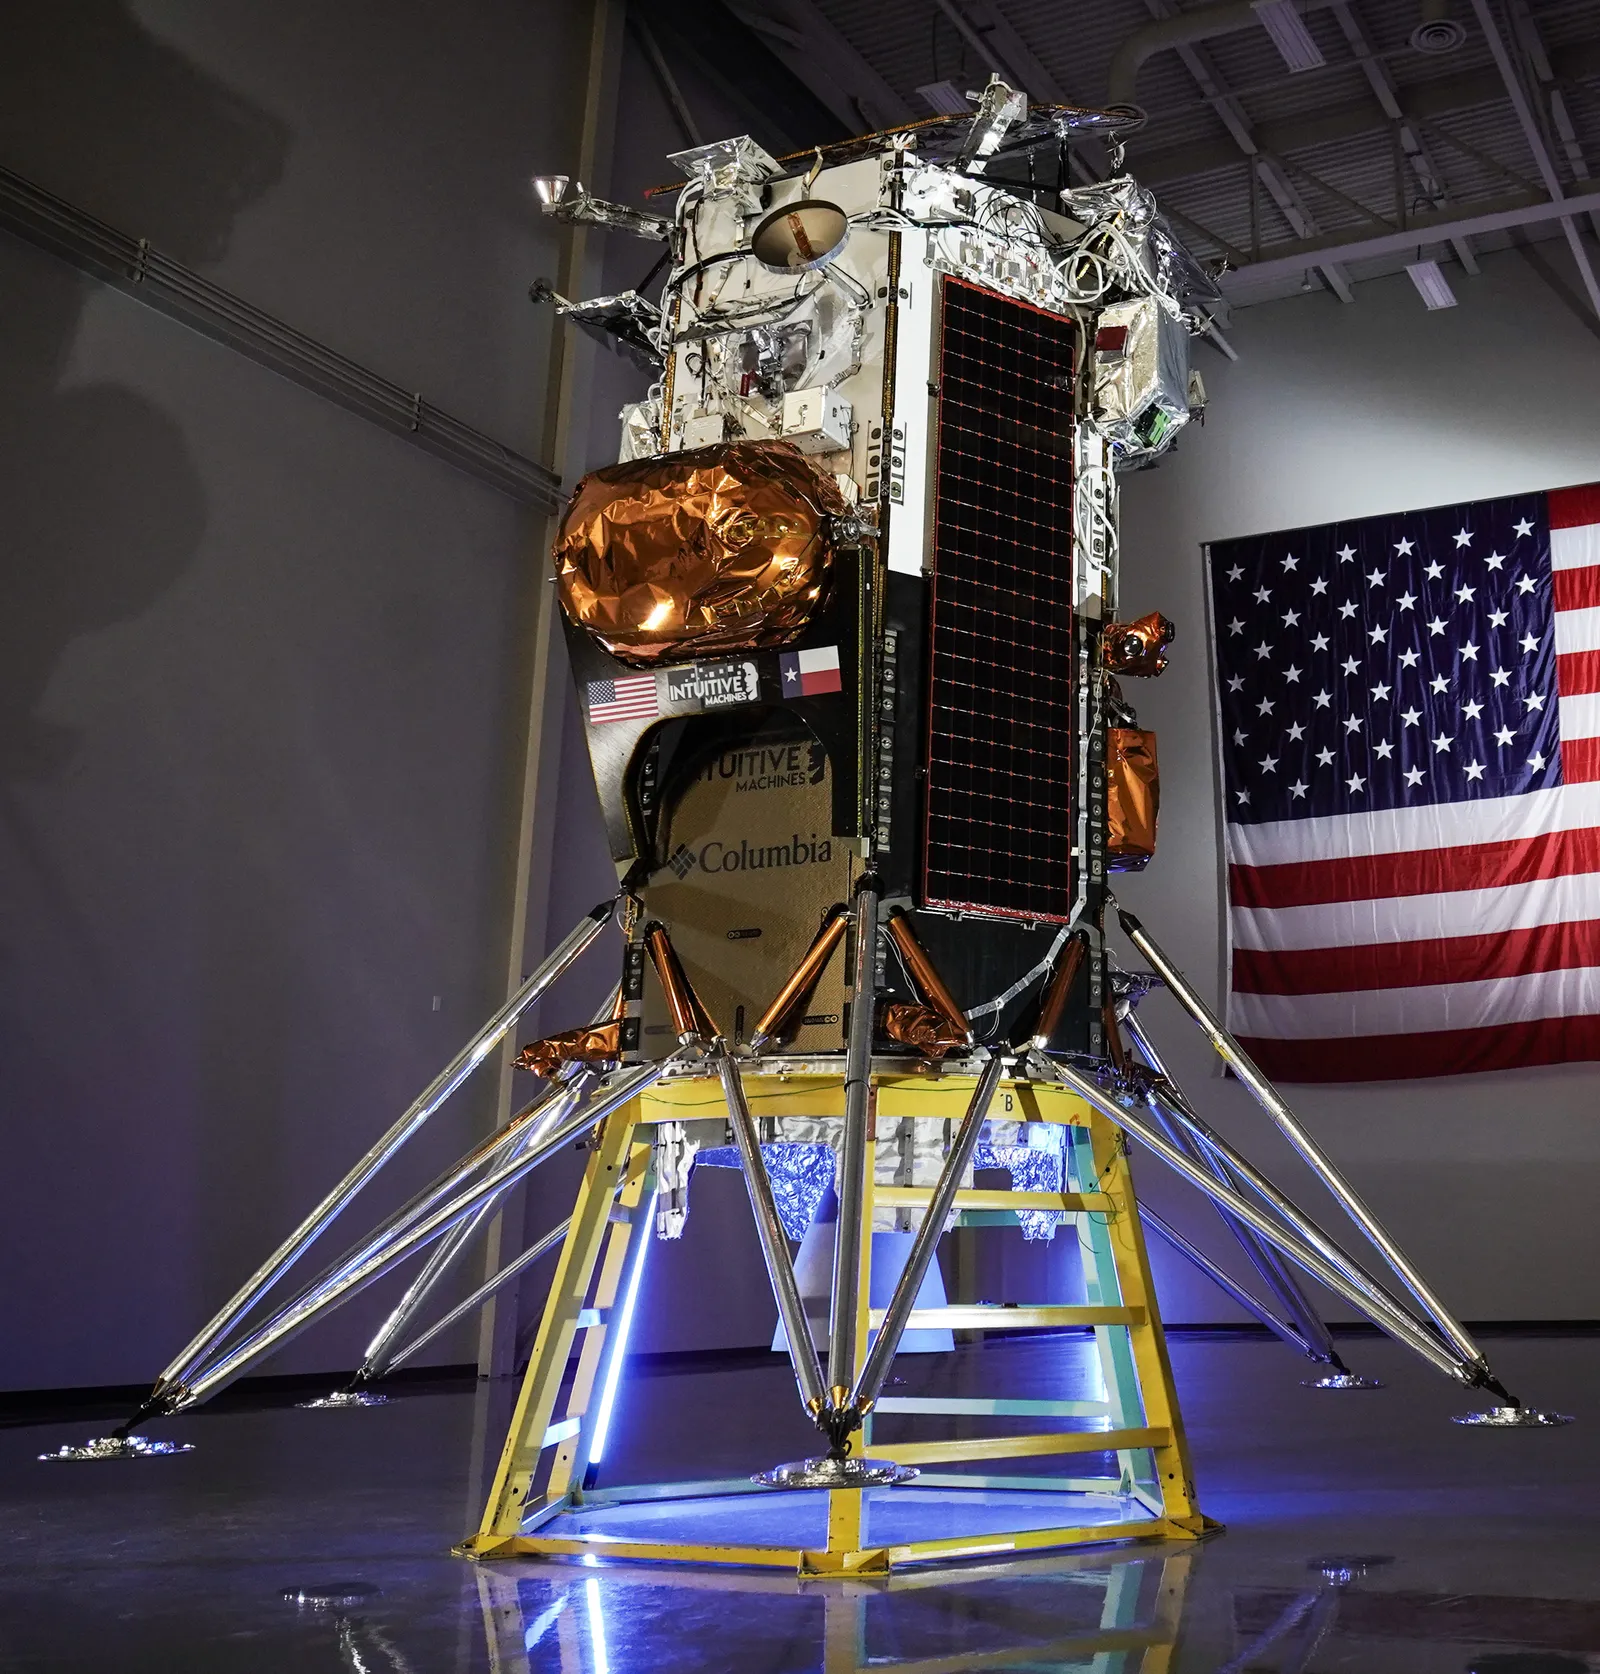
With proposed science cuts of nearly 50%, NASA is shifting to smaller, higher-risk spacecraft and instruments, with greater reliance on commercial partners.
Costlier missions, such as Mars Sample Return, VERITAS, and the Geospace Dynamics Constellation have been canceled or delayed indefinitely.
Would such a change impact science output for the world’s leading space agency?
The Planetary Society attempted to find out.
To gain perspective, we looked at 134 NASA-led science missions launched by all five science divisions between 1980 and 2021.
We assembled a dataset of 146,808 peer-reviewed publications associated with these missions after the start of their science operations.
We also collected key metadata, including inflation-adjusted life-cycle costs, launch and development milestones to gain a fuller picture of cost and time investments.
We first looked at very low-cost science missions, those with an inflation-adjusted life-cycle cost of less than $150M.
40 of the total 134 missions fall under this cost threshold.
Half of them launched in 2016 or later.
Of the 135,215 peer-reviewed publications released during all missions’ operating lifetimes…
A mission’s Active Mission Window runs from the start of its science operations to two years after it ended, cut where citations are mature. A paper shared by two missions counts once for each, so these are mission papers, not distinct papers.
1,329, or 0.98%, came from missions at or below $150M. These publications range up to 134 citations accrued in a fixed four-year window.
In each of the four divisions, missions below $150M averaged significantly fewer top-10% papers per mission than their costlier counterparts.
Of the 40 missions at $150M or less, 23% failed or only partly succeeded. Of the 94 costlier missions, 7.4% did.
The time to high-impact science is slower for lower cost missions. Measured from the start of science operations, lower cost missions, on average, take longer to result in a paper that draws enough citations to reach the top 10% of papers in its division.
The cheapest missions took about three times as long.
When looking at citations per dollar, the story gets a bit more complex. Very low cost missions, even with relatively few citations, can keep pace given their low costs.
Some missions, like TRACE, excel in providing high-quality results. Low-cost missions can provide excellent value.
NASA’s newest bet on low-cost science is CLPS, the Commercial Lunar Payload Services program. Instead of building its own landers, NASA buys rides for its instruments on commercial ones.
The first CLPS lander launched in 2024, too recently to judge by citations, so we counted publications instead.
In the 32 months since, the four landers with published results have produced 15 peer-reviewed papers between them.
How does that stack up? Compare two earlier NASA missions to the Moon and Mars: LCROSS ($139M) and Mars Pathfinder ($613M).
At the same point in their lives, LCROSS had 24 and Mars Pathfinder had 67 papers; by the 36-month mark, 24 and 72. So far, all the CLPS landers combined have fewer papers than either mission had alone. It’s early, and that could change.
There are many good reasons to fly small missions. They train the next generation of scientists and engineers, try out new technology, open access to space to more teams and institutions, and many are driven by genuine scientific questions.
But the data suggests small missions won’t replace dedicated mid- and large-class science missions. In all four divisions we compared, missions at $150M or less produced fewer top-10% papers per mission than their costlier counterparts.
With 40 missions at or under $150M, one mission can move a group’s numbers, and none of this sets a right price for a mission. Each division’s record is below, mission by mission.
Explore Data for Each Division
- Astrophysics 25 missions, 63,383 tracked publications, 3,416,710 citations, published 1983–2026 Counting its missions from cheapest to costliest, the middle half of its top-10% papers came from missions costing $1.1B to $14B.
- Biological & Physical Sciences 5 missions, 15 tracked publications, 236 citations, published 2011–2021
- Earth Science 40 missions, 50,650 tracked publications, 1,605,946 citations, published 1981–2026 Counting its missions from cheapest to costliest, the middle half of its top-10% papers came from missions costing $1.3B to $2.3B.
- Heliophysics 29 missions, 18,323 tracked publications, 591,462 citations, published 1980–2026 Counting its missions from cheapest to costliest, the middle half of its top-10% papers came from missions costing $242M to $1.5B.
- Planetary Science 35 missions, 15,706 tracked publications, 584,964 citations, published 1990–2026 Counting its missions from cheapest to costliest, the middle half of its top-10% papers came from missions costing $778M to $4.0B.