Planetary Science
Planetary Science sends spacecraft to explore destinations in our solar system, from the Moon to beyond Pluto.
Publications and citations by year
Publications per yearCumulative citations
Citations per $100M, by mission
Each square is a mission at its cost and its citations per $100M, both on log scales. The running average combines mission rates across a broad range of nearby costs, giving closer missions more weight. Missions with no citations remain included and sit on the bottom row. Shading shows a 95% interval for the average at each cost.
Missions
| Image | ||||||
|---|---|---|---|---|---|---|
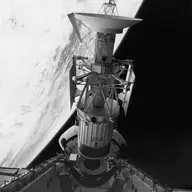 | Magellan | 1989 | Orbiter | $1.7B | 381 | 14,205 |
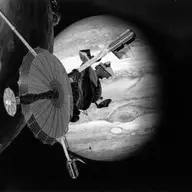 | Galileo | 1989 | Orbiter | $4.6B | 1,554 | 64,875 |
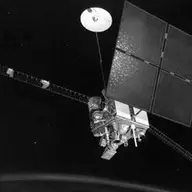 | Mars Observer Failure | 1992 | Orbiter | $2.5B | 4 | 59 |
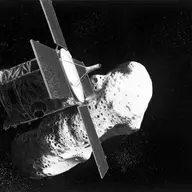 | NEAR Shoemaker | 1996 | Orbiter | $486M | 158 | 7,315 |
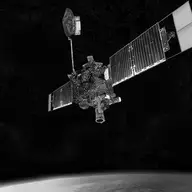 | Mars Global Surveyor | 1996 | Orbiter | $550M | 1,504 | 82,620 |
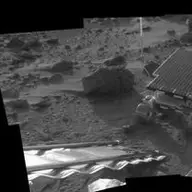 | Mars Pathfinder | 1996 | Lander | $613M | 154 | 8,792 |
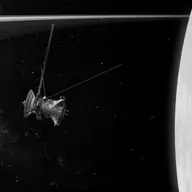 | Cassini | 1997 | Orbiter | $7.6B | 3,404 | 122,578 |
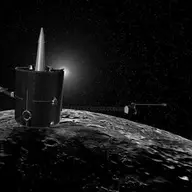 | Lunar Prospector | 1998 | Orbiter | $131M | 287 | 14,658 |
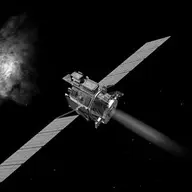 | DS-1 | 1998 | Flyby | $315M | 57 | 1,720 |
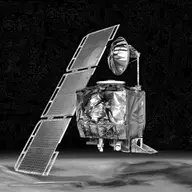 | Mars Climate Orbiter Failure | 1998 | Orbiter | $306M | 0 | 0 |
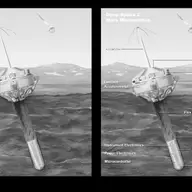 | DS-2 Failure | 1999 | Impactor | $58M | 0 | 0 |
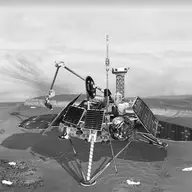 | Mars Polar Lander Failure | 1999 | Lander | $306M | 0 | 0 |
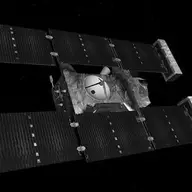 | Stardust | 1999 | Sample Return | $464M | 339 | 15,340 |
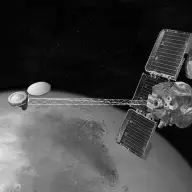 | Mars Odyssey | 2001 | Orbiter | $449M | 611 | 28,436 |
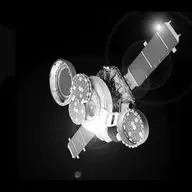 | Genesis | 2001 | Sample Return | $411M | 70 | 3,985 |
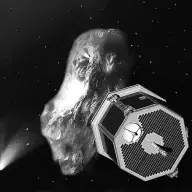 | CONTOUR Failure | 2002 | Flyby | $297M | 0 | 0 |
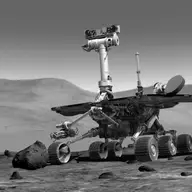 | Spirit | 2003 | Rover | $756M | 453 | 22,450 |
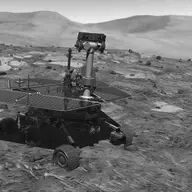 | Opportunity | 2003 | Rover | $756M | 451 | 23,741 |
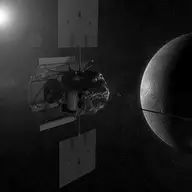 | MESSENGER | 2004 | Orbiter | $778M | 767 | 27,240 |
 | Deep Impact (EPOXI) | 2005 | Impactor | $624M | 314 | 12,211 |
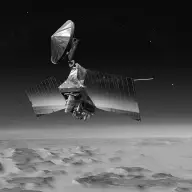 | MRO | 2005 | Orbiter | $1.4B | 1,285 | 46,266 |
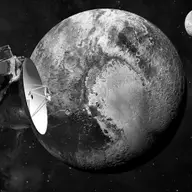 | New Horizons | 2006 | Flyby | $1.2B | 436 | 10,453 |
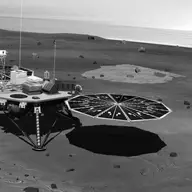 | Phoenix | 2007 | Lander | $869M | 236 | 10,450 |
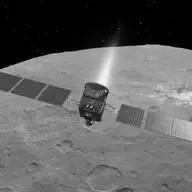 | Dawn | 2007 | Orbiter | $883M | 422 | 13,711 |
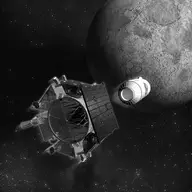 | LCROSS | 2009 | Impactor | $139M | 57 | 2,984 |
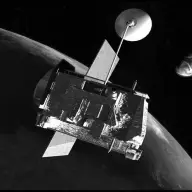 | LRO | 2009 | Orbiter | $806M | 1,016 | 29,816 |
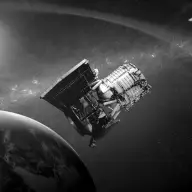 | NEOWISE | 2009 | Survey Observatory | $484M | 109 | 4,509 |
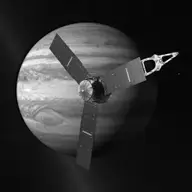 | Juno | 2011 | Orbiter | $1.7B | 835 | 19,302 |
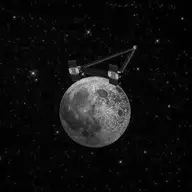 | GRAIL | 2011 | Orbiter | $725M | 192 | 7,703 |
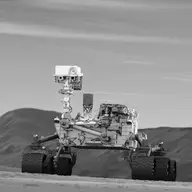 | Curiosity | 2011 | Rover | $4.0B | 1,116 | 39,970 |
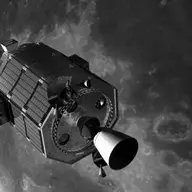 | LADEE | 2013 | Orbiter | $378M | 75 | 1,775 |
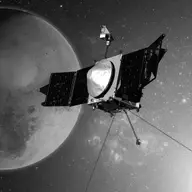 | MAVEN | 2013 | Orbiter | $971M | 961 | 23,476 |
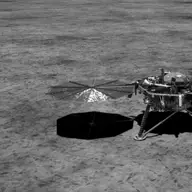 | InSight | 2018 | Lander | $1.4B | 370 | 8,543 |
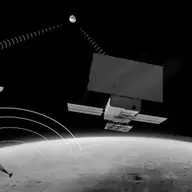 | MarCO | 2018 | Flyby | $24M | 1 | 20 |
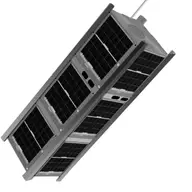 | Q-PACE Failure | 2021 | Orbiter | $0.6M | 0 | 0 |
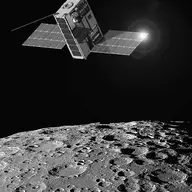 | Lunar IceCube Failure | 2022 | Orbiter | $12M | 0 | 0 |
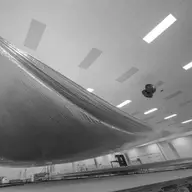 | NEA Scout Failure | 2022 | Orbiter | $24M | 0 | 0 |