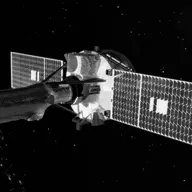
Remote Sensing Observatory · Competed · PI-led · Launched on June 28, 2013 · Extended Mission · LCC: $120M/$172M (2025 $)Life-cycle cost: NASA’s reported cost to build, launch, and operate a mission through its prime mission, plus documented partner contributions, in 2025 dollars. Extended missions are not included. Methods · Wikipedia
ScopeActive Mission WindowActivePapers published from the first full month after science operations begin through two years after the mission ends. Citations are counted through the third calendar year after each paper appears. For IRIS, papers published August 1, 2013 to January 1, 2024. Methods/LifetimeLifetimeEvery tracked publication to date, with every citation to date. For IRIS, papers published from 2013 to November 3, 2026. Methods
Tracked publicationsTracked publications: peer-reviewed papers we found that name the mission or its instruments in their titles, abstracts, or keywords. Papers that used the data without naming it are missed. Methods
677
CitationsCitations: every citation these publications have drawn to date. Older missions have had longer to collect them. Methods
19,200
Citation indices
h-indexh-index: the largest h such that h papers have at least h citations each. It only grows with time, so older missions score higher. Methods
66
g-indexg-index: the largest g for which the g most-cited papers together hold at least g² citations. Like the h-index, but it lets the most-cited papers count for more. Methods
99
m-indexm-index: a mission’s h-index divided by the years since its first peer-reviewed paper. It falls every 1 January even when nothing else changes; the figure shown is as of November 3, 2026. It also discounts the long operating life that larger missions paid for. Methods
4.7
toritori (total research impact, from SciX): for every paper citing one of the mission’s papers, 1 divided by the citing paper’s reference count times the cited paper’s author count, summed, with self-citations removed. It favors citations from papers with short reference lists and from outside the mission’s own authors. Computed over the tracked citation graph, which can be slightly incomplete. Always over every tracked publication to date, whichever scope is chosen. Methods
63
riqriq (research impact quotient): 1,000 times the square root of tori, divided by the years since the mission’s first paper. A rate, not a total, so it does not keep growing with age the way the h-index and tori do. Like tori, always over every tracked publication to date. Methods
567
Publications and citations by year (lifetime)
Publications per yearCumulative citations
Institutional contributions (lifetime)The institutions SciX lists for each paper’s authors, as printed on the paper, located through the Research Organization Registry. A square counts a paper once, however many of its authors worked there. Methods
We searched NASA’s Science Explorer (SciX) for peer-reviewed articles naming IRIS in the title, abstract or keywords; standard filters drop articles that are not peer-reviewed and magazine pieces.
((=abs:"Interface Region Imaging Spectrograph" OR (abs:"IRIS" AND NOT =abs:Voyager AND NOT =abs:"IRIS rocket" AND NOT =abs:"coronas-f" AND NOT =abs:"koronas-f" AND (=abs:sun OR abs:chromosphere OR abs:corona OR abs:flare)))) AND property:refereed AND doctype:article AND pubdate:[2013-08 TO 2040-01] AND NOT bibstem:("A&R" OR "ACPD" OR "AIASJ" OR "AMTD" OR "AeAm" OR "AirSp" OR "AsNow" OR "AsUAI" OR "AvWST" OR "BGD" OR "C&E" OR "C&T" OR "CAPJ" OR "CliPD" OR "E&S" OR "ENews" OR "ESDD" OR "ESSDD" OR "ESuDD" OR "GID" OR "GMDD" OR "GeCAS" OR "HESSD" OR "IrAJ" OR "JCos" OR "JRASC" OR "LAstr" OR "MNSSA" OR "Met" OR "NHESD" OR "NPGD" OR "NewSc" OR "OcScD" OR "Orion" OR "PhT" OR "PhTea" OR "PhuZ" OR "PhyOJ" OR "PhyW" OR "PlR" OR "SOILD" OR "SciAm" OR "SpFl" OR "TCD" OR "ZemVs")