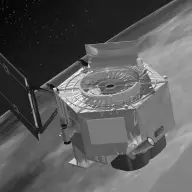
848 tracked publications and 32,401 citations from 2001–2026. Earth Observing-1. Launched 2000. Life-cycle cost: $404M in 2025 dollars. Active Mission Window December 1, 2000 to April 1, 2019: 654 publications, 30 top-10% credit.
Orbiter · h-index 83 · 66 papers with 100+ citations · prime mission ended 2001
Lifetime
ScopePapers published from the first full month after science operations begin through 2 years after the mission ends. Citations are counted through the third calendar year after each paper appears. Methods/Papers published from the first full month after science operations begin through 2 years after the prime mission ends. Citations are counted through the third calendar year after each paper appears. Methods/Every tracked publication to date, with every citation to date. Methods
Key measures
Active Mission Window · papers December 1, 2000 to April 1, 2019
Tracked publicationsTracked publications: peer-reviewed research papers we found for the mission. The list may not be complete. Methods
654654
CitationsCitations received by the tracked publications in the selected scope. The two windowed scopes count each paper’s citations only within its citation window. Methods
5,1595,159
Mean citations per publicationMean citations: total citations divided by tracked publications in the selected scope. One blockbuster paper can lift it. Methods
7.97.9
Median citations per publicationMedian citations: the middle paper’s citation count in the selected scope; half the papers have more, half fewer. A single blockbuster sways it less than the mean. Methods
55
Uncited publicationsUncited publications: papers with no citations in the selected scope. Methods
71 (11%)71 (11%)
Top-10% creditTop 10%: among the 10% most-cited papers from this division’s missions, ranked against papers published around the same time. A paper naming several missions is split evenly among the missions in this division that claim it, so counts can be fractional. Methods
3030· 0.79% of division
Top-1% creditTop 1%: among the 1% most-cited papers from this division’s missions within the selected window. Not adjusted for publication year. A paper naming several missions is split evenly among the missions in this division that claim it, so counts can be fractional. Methods
2.52.5· 0.65% of division
Lifetime indices · every tracked publication to date, in any scope
h-indexh-index: the largest h such that h papers have at least h citations each. It only grows with time, so older missions score higher. Methods
8383
g-indexg-index: the largest g for which the g most-cited papers together hold at least g² citations. Like the h-index, but it lets the most-cited papers count for more. Methods
145145
m-index, as of October 4, 2026m-index: a mission’s h-index divided by the years since its first peer-reviewed paper. It falls every 1 January even when nothing else changes, so it belongs to the date shown; it also discounts the long operating life that larger missions paid for. Methods
3.23.2
toritori (total research impact, from ADS): for every paper citing one of the mission’s papers, 1 divided by the citing paper’s reference count times the cited paper’s author count, summed, with self-citations removed. It favors citations from papers with short reference lists and from outside the mission’s own authors. Computed over the tracked citation graph, which can be slightly incomplete. Methods
287287
riqriq (research impact quotient): 1,000 times the square root of tori, divided by the years since the mission’s first paper. A rate, not a total, so it does not keep growing with age the way the h-index and tori do. Methods
We searched NASA’s Astrophysics Data System (ADS) for peer-reviewed articles naming EO-1 in the title, abstract or keywords; standard filters drop articles that are not peer-reviewed and magazine pieces. SciX is ADS’s current interface.
((=abs:"Earth Observing-1" OR =abs:"Earth Observing 1" OR =abs:"Earth Observing One" OR (abs:"EO-1" AND (abs:Hyperion OR =abs:"Advanced Land Imager" OR abs:Landsat OR abs:hyperspectral OR =abs:"remote sensing" OR abs:multispectral OR abs:"ETM+" OR abs:satellite OR =abs:"Earth observation" OR abs:AVIRIS)) OR (abs:Hyperion AND (abs:hyperspectral OR abs:Landsat OR =abs:"remote sensing")) OR =abs:"Advanced Land Imager" OR (abs:"ALI" AND (=abs:"Advanced Land Imager" OR abs:Landsat OR abs:Hyperion)))) AND property:refereed AND doctype:article AND pubdate:[2000-12 TO 2040-01] AND NOT bibstem:("A&R" OR "AIASJ" OR "AeAm" OR "AirSp" OR "AsNow" OR "AsUAI" OR "AvWST" OR "C&E" OR "C&T" OR "CAPJ" OR "E&S" OR "ENews" OR "IrAJ" OR "JCos" OR "JRASC" OR "LAstr" OR "MNSSA" OR "Met" OR "NewSc" OR "Orion" OR "PhT" OR "PhTea" OR "PhuZ" OR "PhyOJ" OR "PhyW" OR "PlR" OR "SciAm" OR "SpFl" OR "ZemVs")